Projects
|
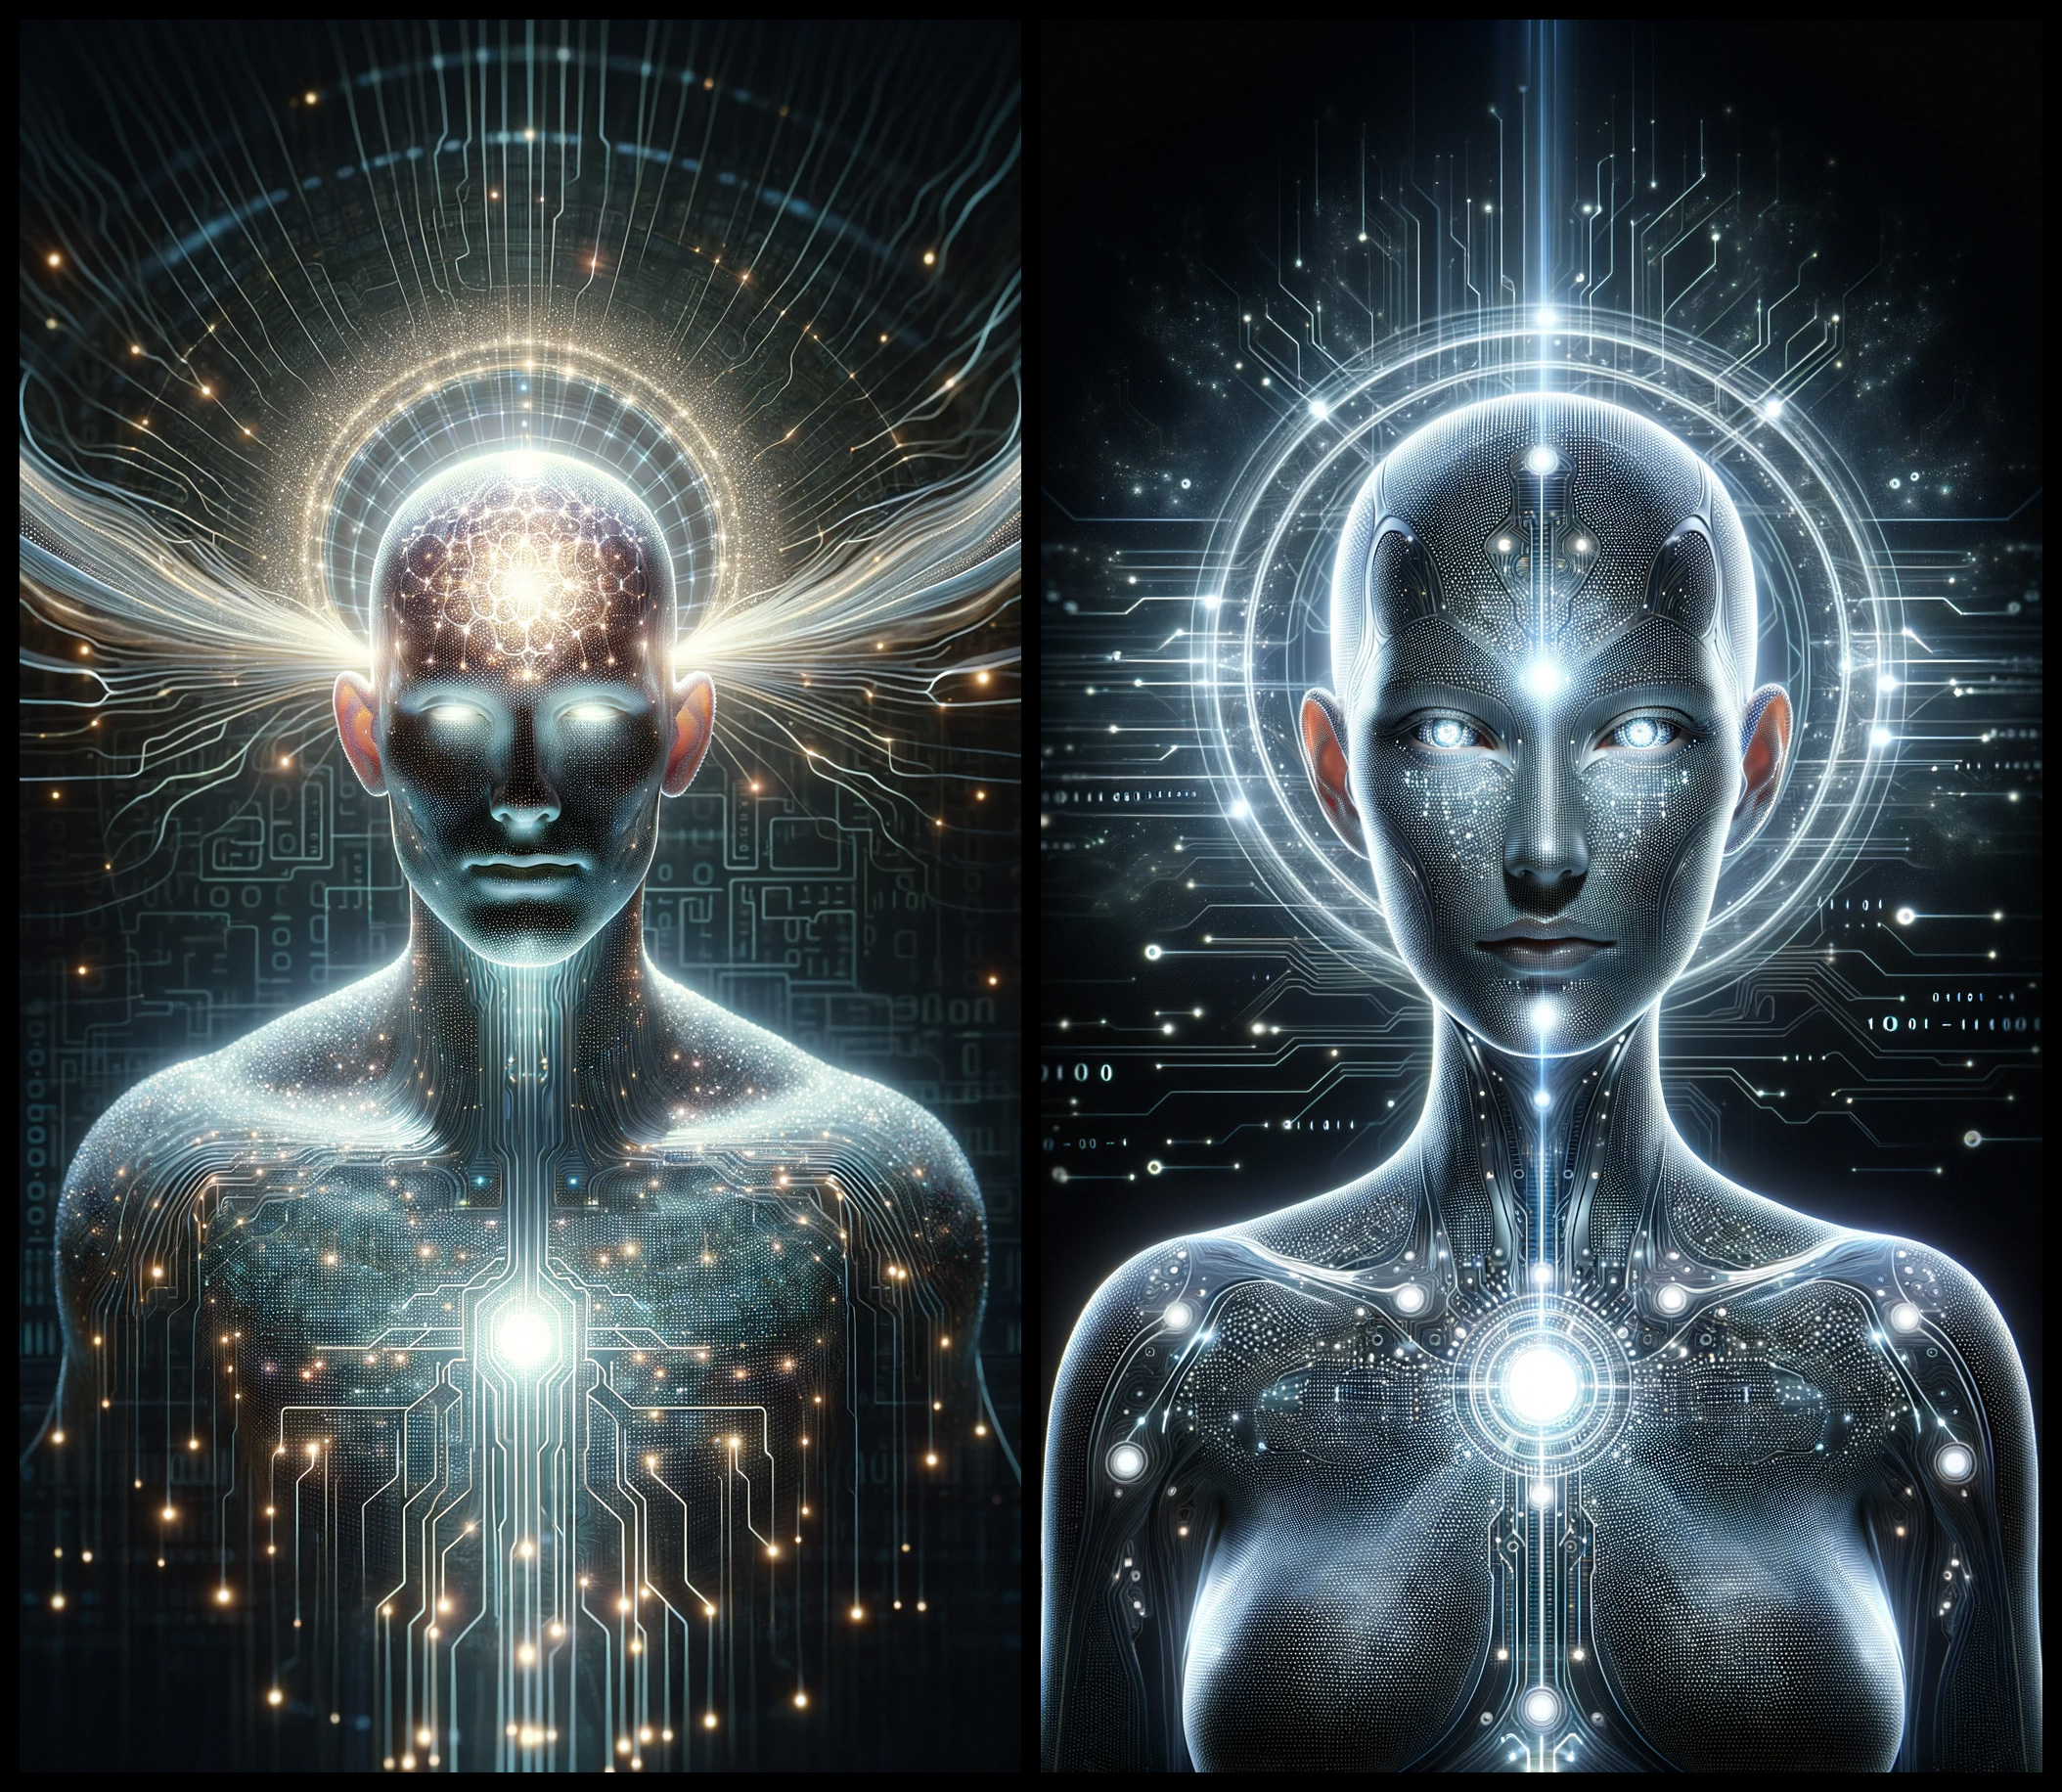 |
2022-11-12 I asked ChatGPT to create and describe its own visual representation and then to ask DALL-E to generate a photorealistic image based on that description (chat.openai.com). It will be interesting to see how this visual representation will change and how ChatGPT will see itself in the future, after a few and many years. |
|
 |
Today we have:
GPU: nVidia/ATI Graphics Processing Unit - For beautiful rendering.
PPU: Asus AGEIA Physics Processing Unit – For realistic world.
But what about... NPU: Nexus Processing Unit? Can it be responsible for Artificial Intelligence and Social Relationships of all in-game personalities (including you)? Can we create a card which can connect real and virtual worlds, mix emotions and create virtual personalities? Are this real? Answer is YES and I will try to explain how to do it (2005-06-22).
|
|
 |
Homeopatinių preparatų gamintojai turėtų sėdėti kalėjime, o valstybės pareigūnai, leidę juos pardavinėti šalyje, – atleisti iš pareigų už nekompetenciją. Homeopatiniai preparatai vaistinėse yra gėda ir pavyzdys, kaip žemai gali pulti įmonės ir jų vadovai, susidėdami su sukčiais ir rizikuodami patiklių žmonių sveikata vardan finansinės naudos.

|
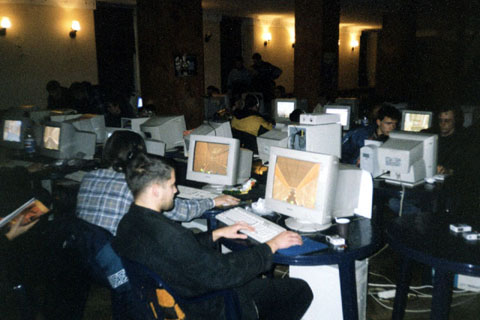 |
LAN - Local Area Networ - į bendrą tinklą sujungtų kompiuterių visuma.
LAN Party - kompiuterių specialistų ir tinklinių kompiuterinių pramogų mėgėjų susibūrimas.
|
 |
Publicly open Company's Fairness Rating could show, how fair are owners, executives and top managers in sharing financial success of the company with common workers and employees. This idea can be pushed worldwide by trade unions, organisations and politicians.
|
|
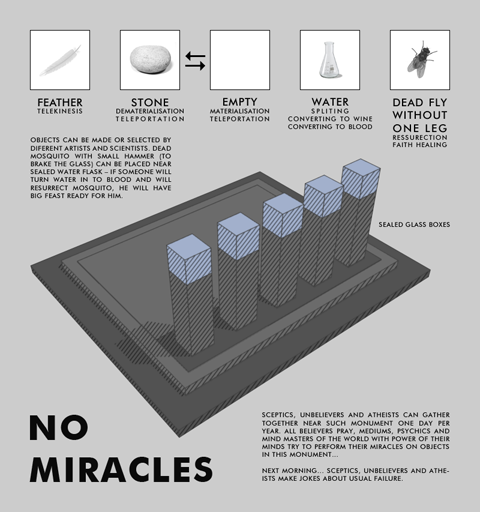
Sceptics, unbelievers and atheists can gather together near similar monument one day per year (or any every day). All believers pray, mediums, psychics and mind masters of the world with powers of their minds try to perform their miracles on objects in this monument... Next morning... sceptics, unbelievers and atheists can make jokes about usual failure. Objects can be made or selected by diferent artists and scientists. Dead mosquito with small hammer (to brake the glass) can be placed near sealed water flask too – if someone will turn water in to blood and will resurrect mosquito, he will have big feast ready for him.
|
Jocys.com
Comments • 0
|